The Problem
My dev machine runs twenty plus containers across five compose projects inside a vm. Something misbehaves, and I do this:
docker ps | grep worker          # find it
docker logs -f a3f2c9d81e4b      # tail it
# wrong container, scroll up, try again
The ID is a hash I have to copy, the name is truncated, and four terminal tabs are each tailing something with no labels. None of it is hard, it is just constant.
It got more annoying when I started on Nimbus (random stand-in name), an AI agent project that
starts a fresh container per chat session. The container I care about did not exist a minute ago, it
is named agent- plus an unpredictable hash, and it disappears when the conversation ends.
A 76-line bash script (agent-logs.sh) covered most of that: list running agent-* containers, pick
one with the arrow keys, default to the newest, then docker logs -f --tail 200. A -g flag piped
the log through grep instead. I used it for weeks.
What it could not do was hold state. Following two containers means two tabs, and changing the grep pattern means starting over, because grep sits in a pipe. That is what pushed this into a browser tab.
Why Not lazydocker, Portainer, Docker Desktop?
I tried them. lazydocker is genuinely good and still lives in a terminal tab, competing with the
tabs I am working in. Portainer is a deployment tool, with stacks and registries and RBAC, when I
want to read logs on localhost. Docker Desktop is not on this machine.
I wanted one page, always open, no install. So the constraint was zero dependencies: no npm install,
no lockfile, nothing to keep updated in six months. The Docker Engine API is on a unix socket and
Node’s standard library can speak HTTP to a unix socket, which is the whole trick:
// the entire "SDK"
http.request({ socketPath: '/var/run/docker.sock', path: '/containers/json', method: 'GET' })
One server file, one HTML file, node server.js. It later got a Python port of the same routes for
boxes without Node, also standard library only.
The Shape
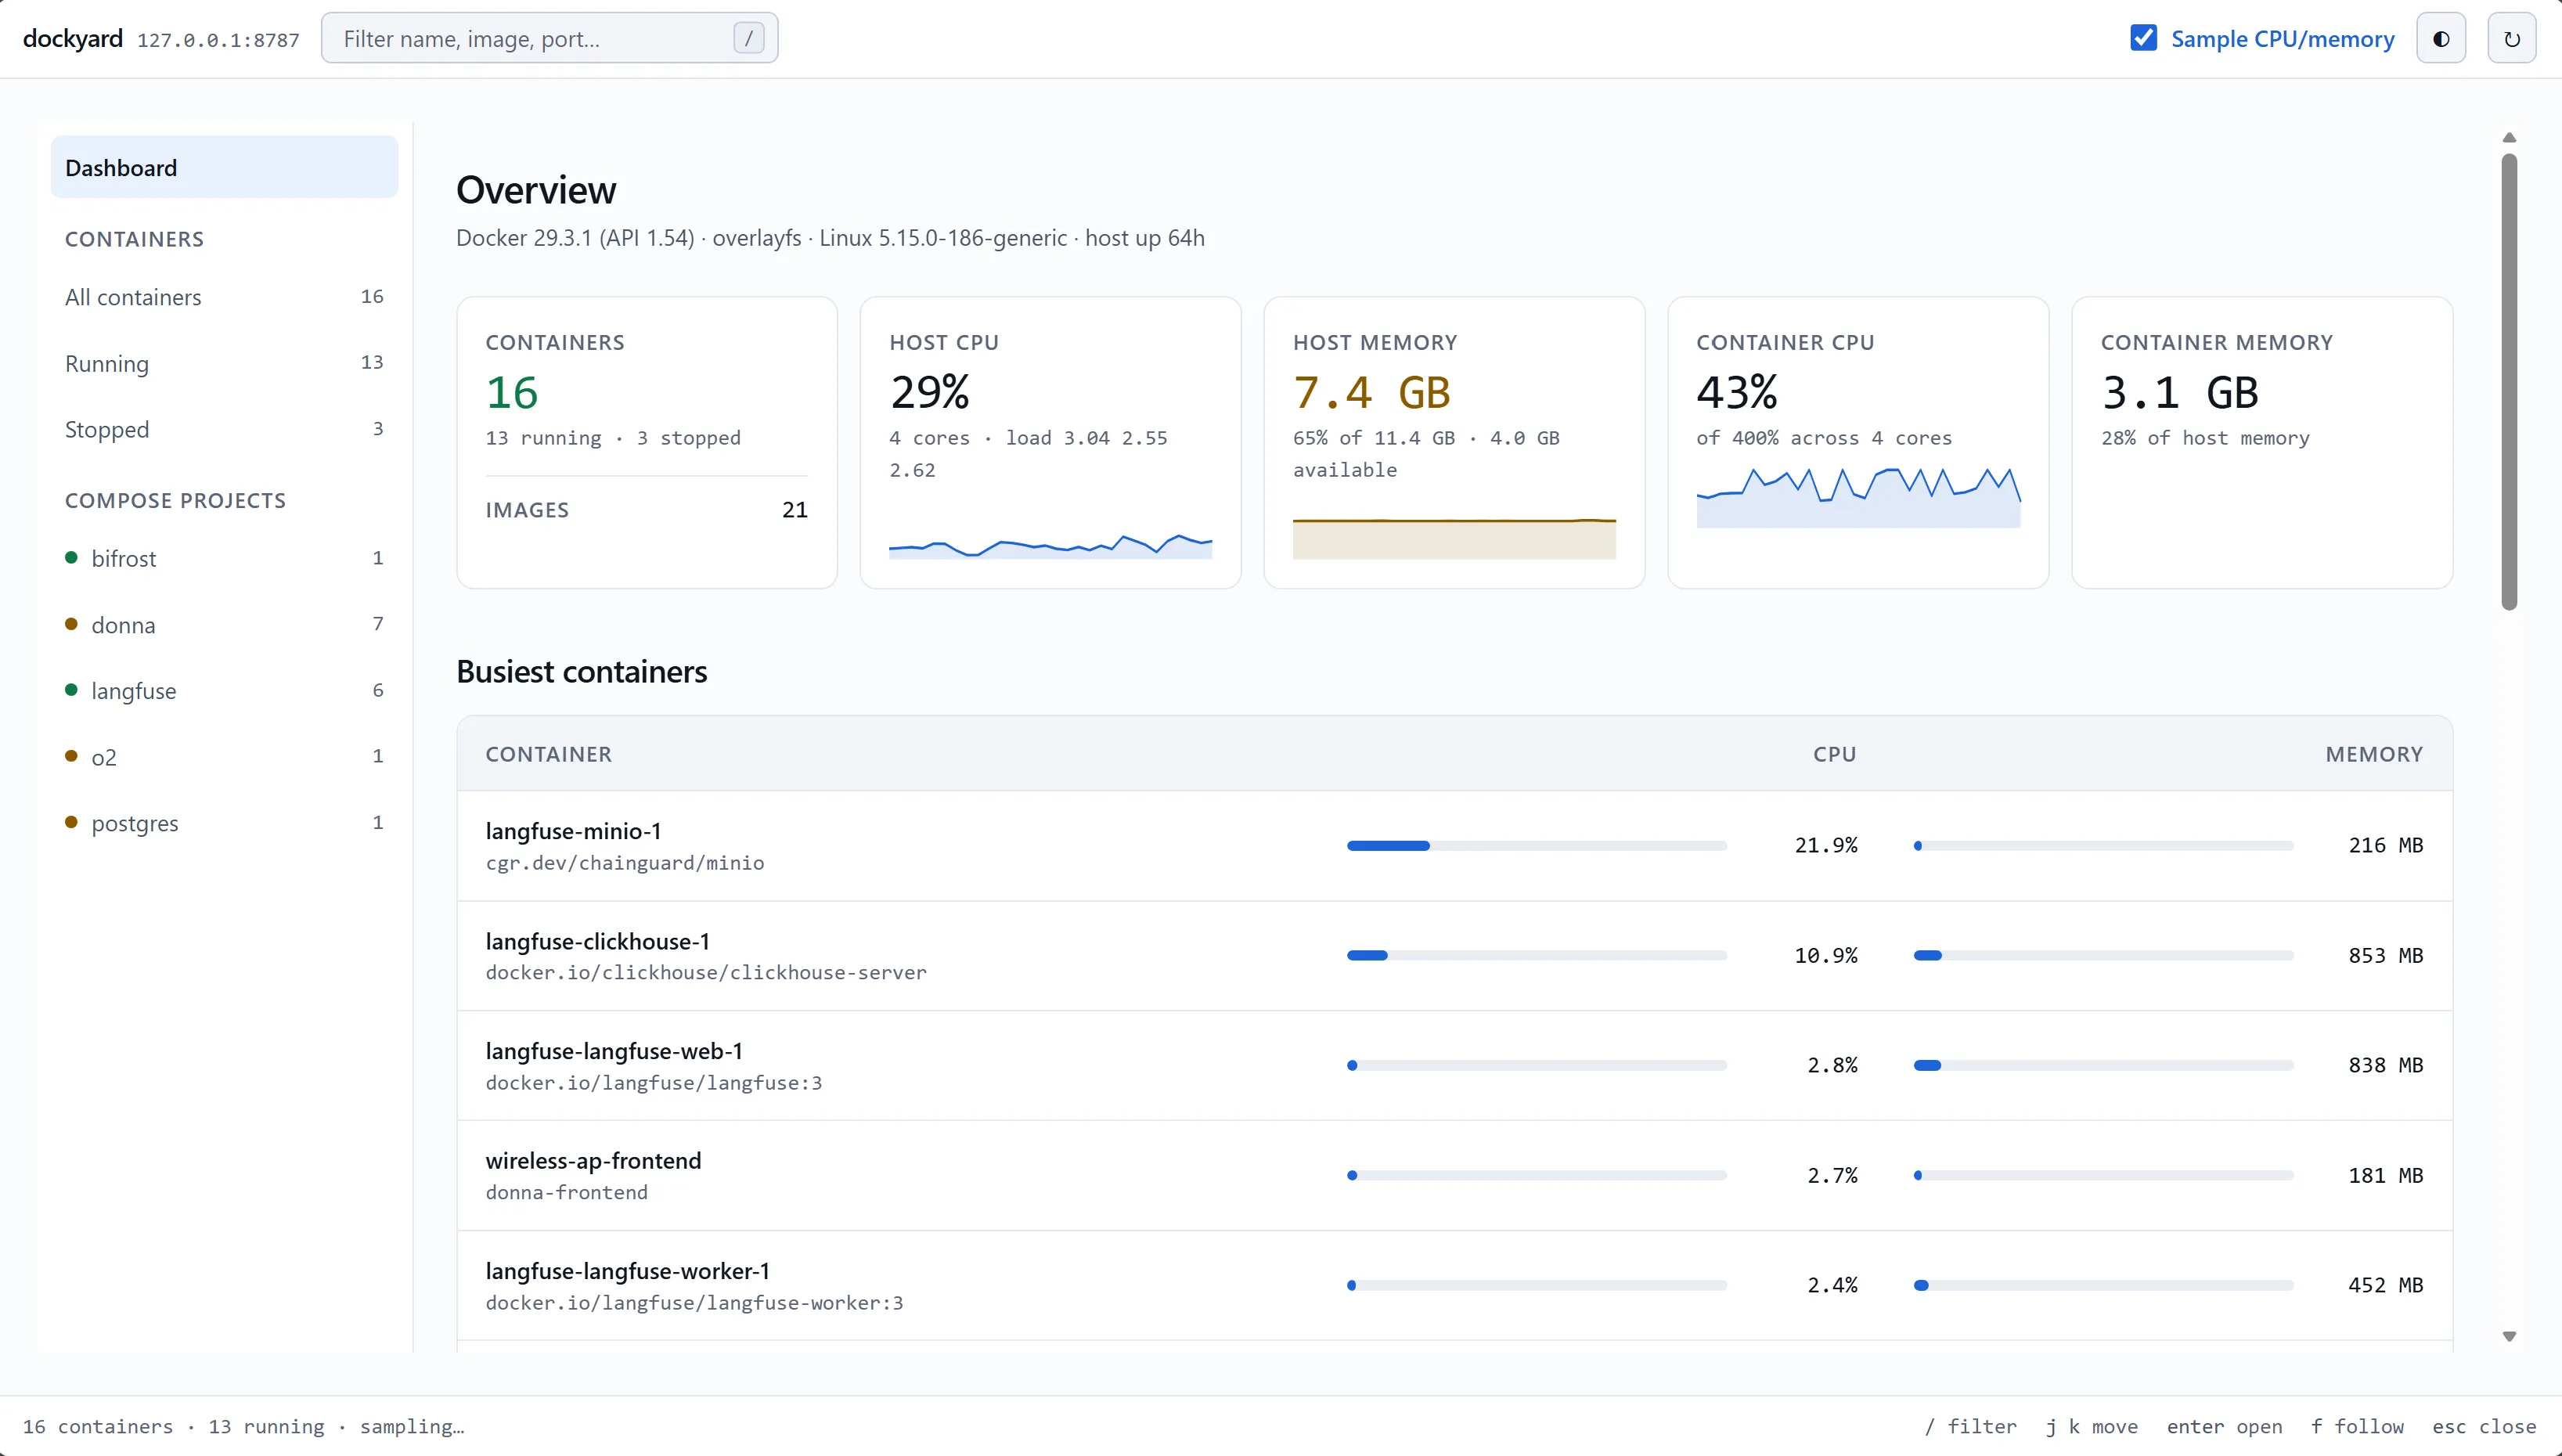
A scope rail (all, running, stopped, then one entry per compose project), the container list, and a tabbed detail panel with overview, logs, stats and ports. Click a container, read its logs. There is a dashboard landing view for host CPU and memory, per project totals and disk usage, and start, stop and restart buttons on each row.
The Features That Mattered
Most of these came from using the tool rather than planning it, which is why they are small:
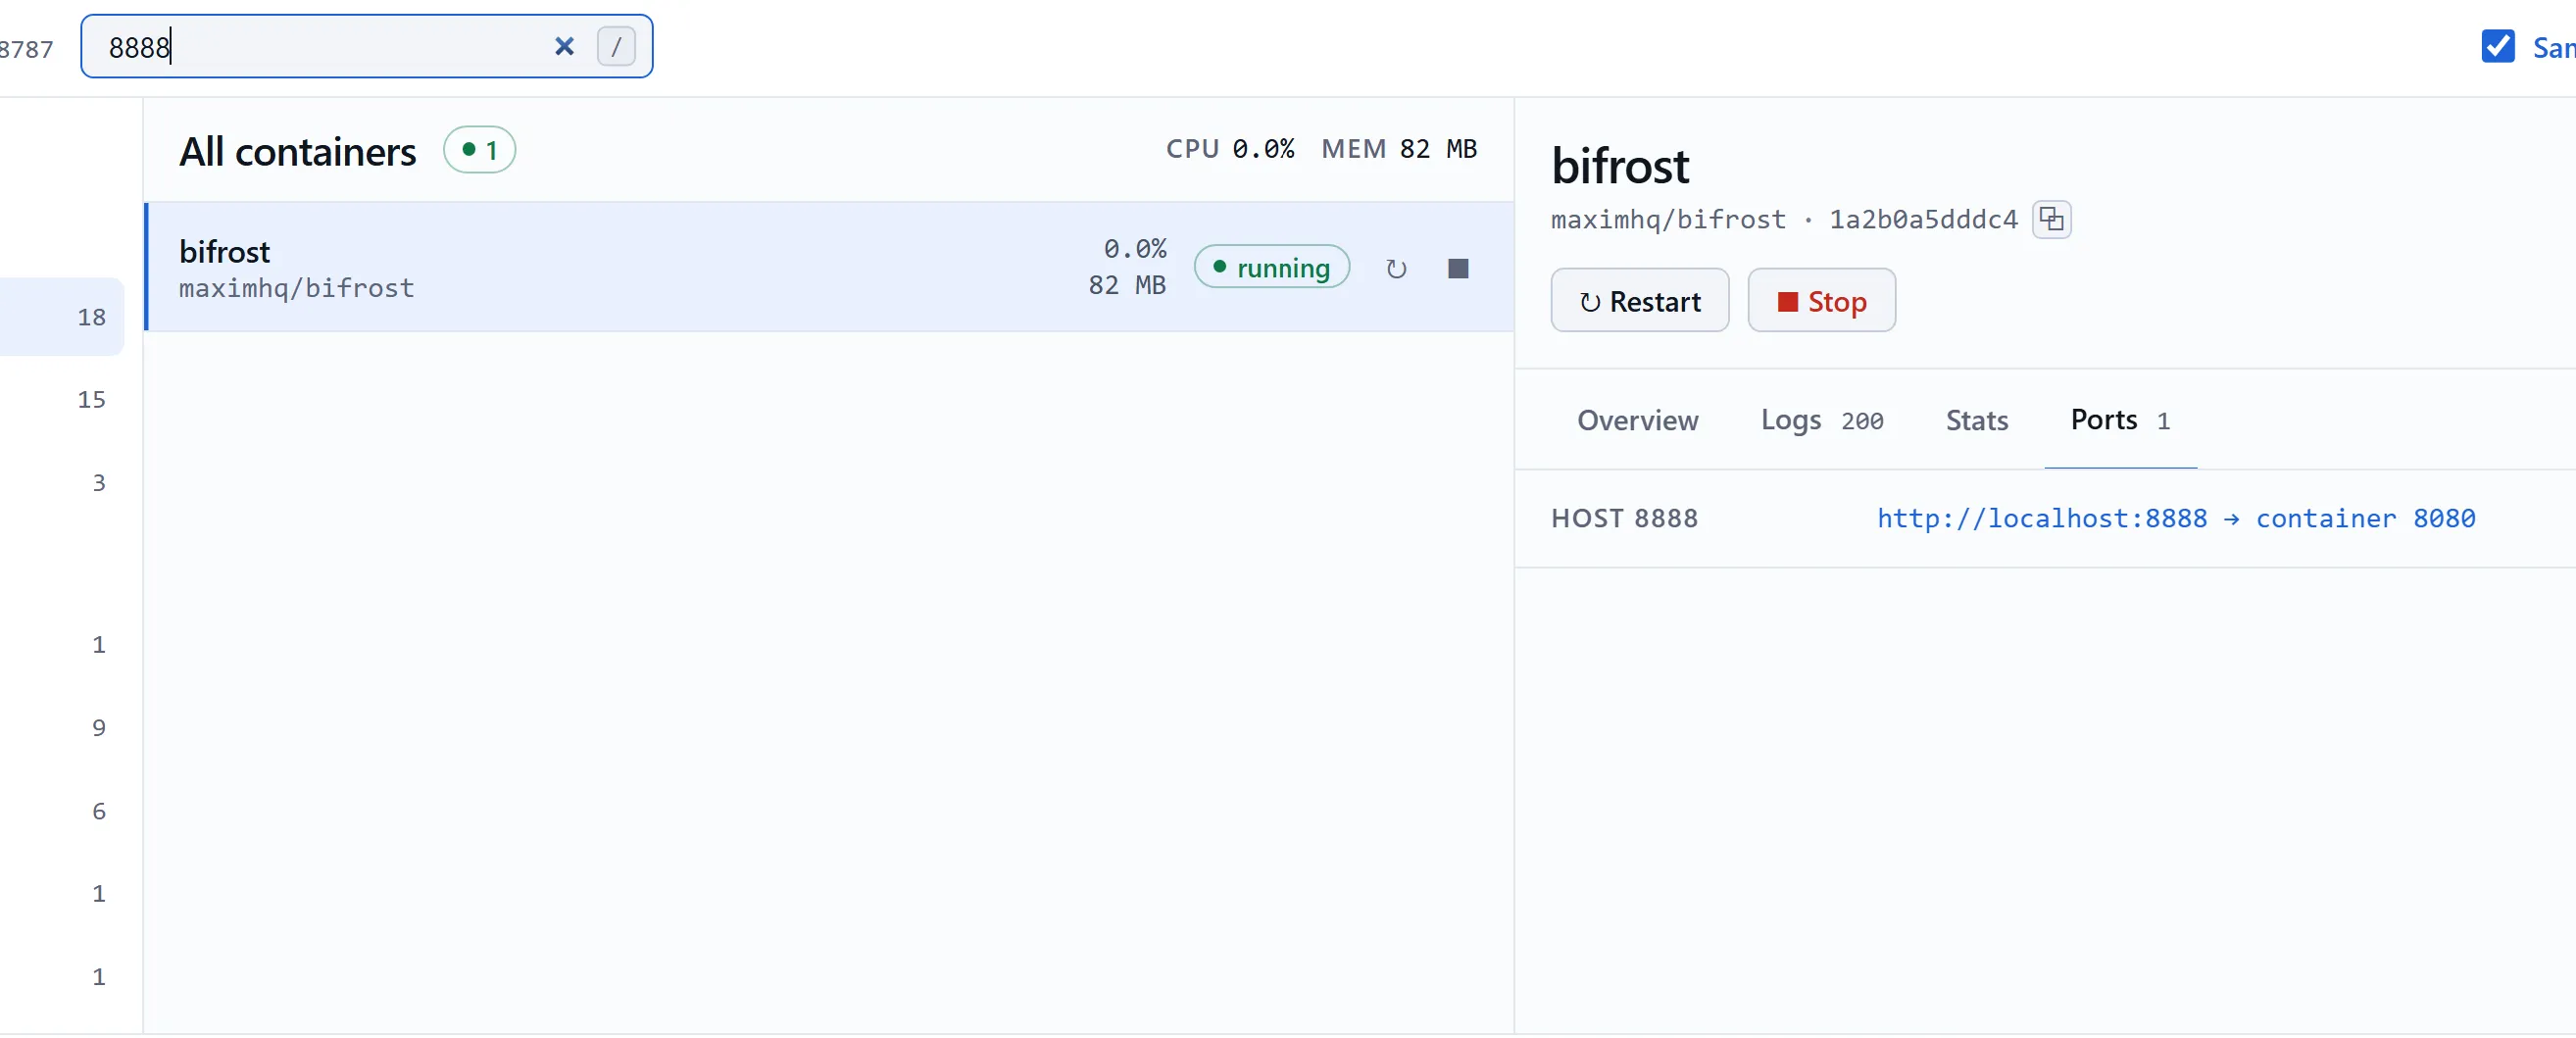
Quick search by name or port etc.
Opening a running container follows by default. For a container that started ten seconds ago a
static snapshot is the wrong default. The stream request carries a tail parameter anyway, so you get
history and live output in one click. Stopped containers still load a snapshot, since following one
ends immediately.
The tail resets to 200 lines when you switch containers, the same number the bash script used. I left it at 5000 once and every switch pulled the new container’s whole buffer first: 2.12 MB and 1.37 seconds, against 85 KB and 0.05 seconds at 200.
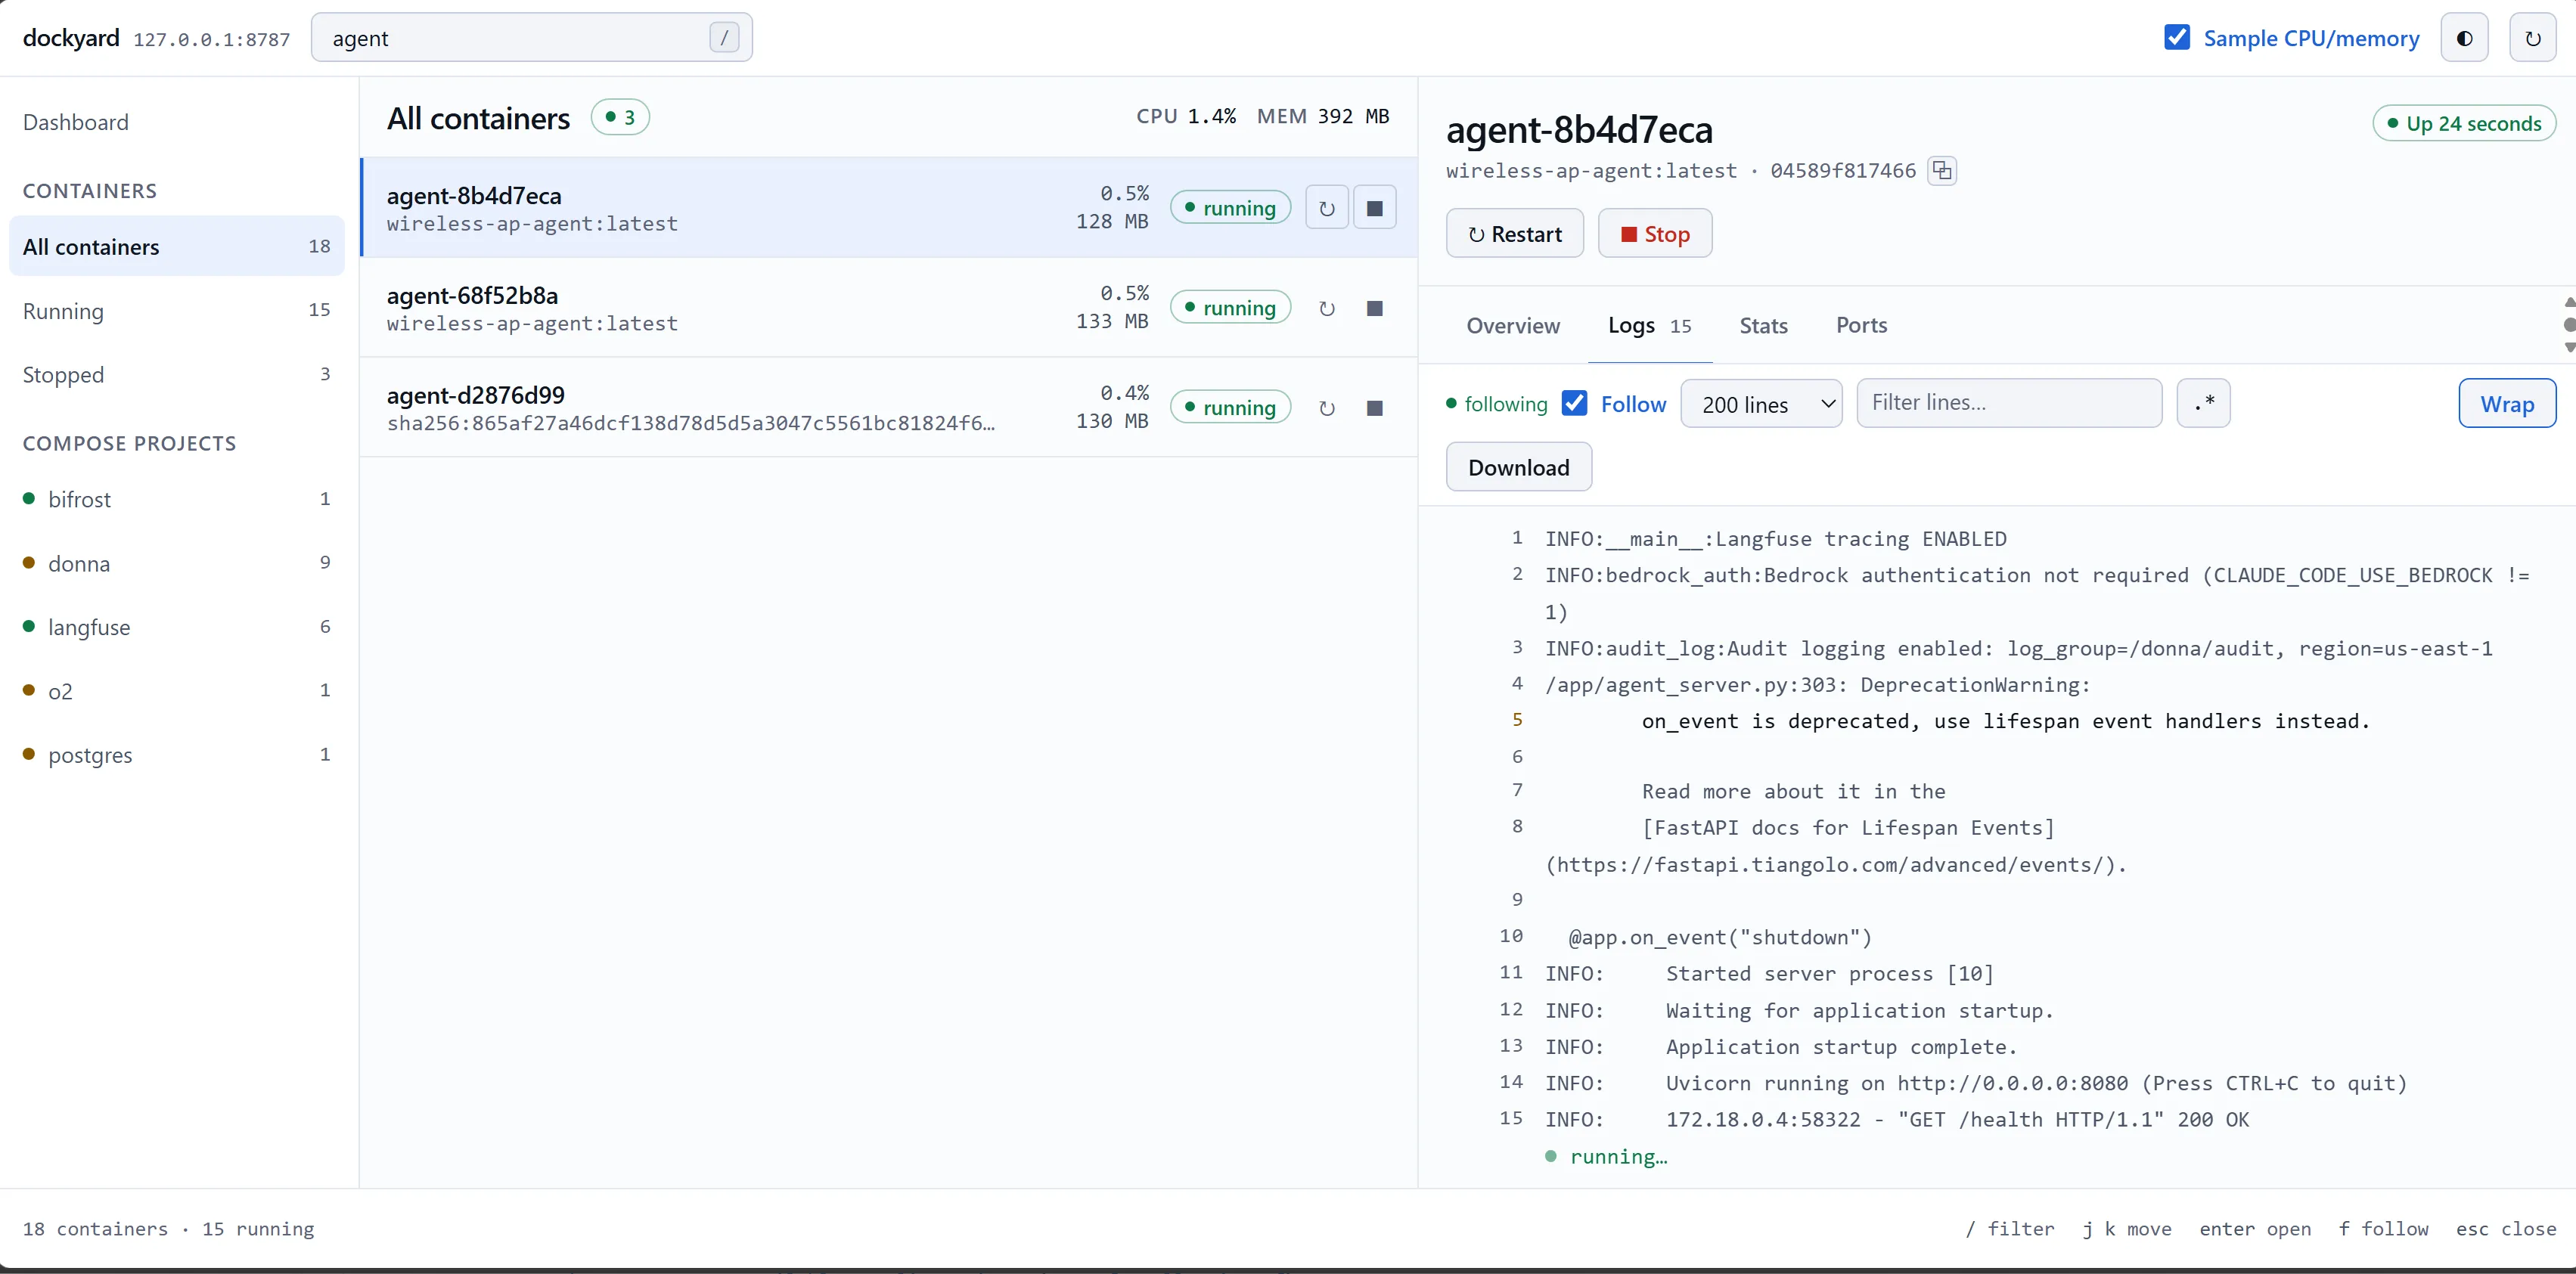
A filter box over the open log, with a regex toggle and a live 12 of 4996 hit count. This is the
bash -g mode, except it runs over a buffer the page already holds, so it applies to a live tail and
you can retype the pattern without dropping the stream. For agent containers that is most of what I do.
A trailing running… row while a stream is open. Without it, a live but quiet container looks
exactly like a dropped connection.
CPU and memory totals in the list header, replacing a static column label that did nothing. Scoping to one compose project re-totals to match, which is how I noticed one project accounting for about 95% of my container CPU.
The Details That Actually Mattered
Docker log output is framed, not plain text. For containers without a TTY, every chunk is prefixed with an 8-byte header: stream type, three zero bytes, then a big-endian length. Serve it raw and you get binary noise through your logs. A frame can also split across chunks, so reassembly has to carry a remainder. This is the fiddliest part of the tool and it is invisible when it works.
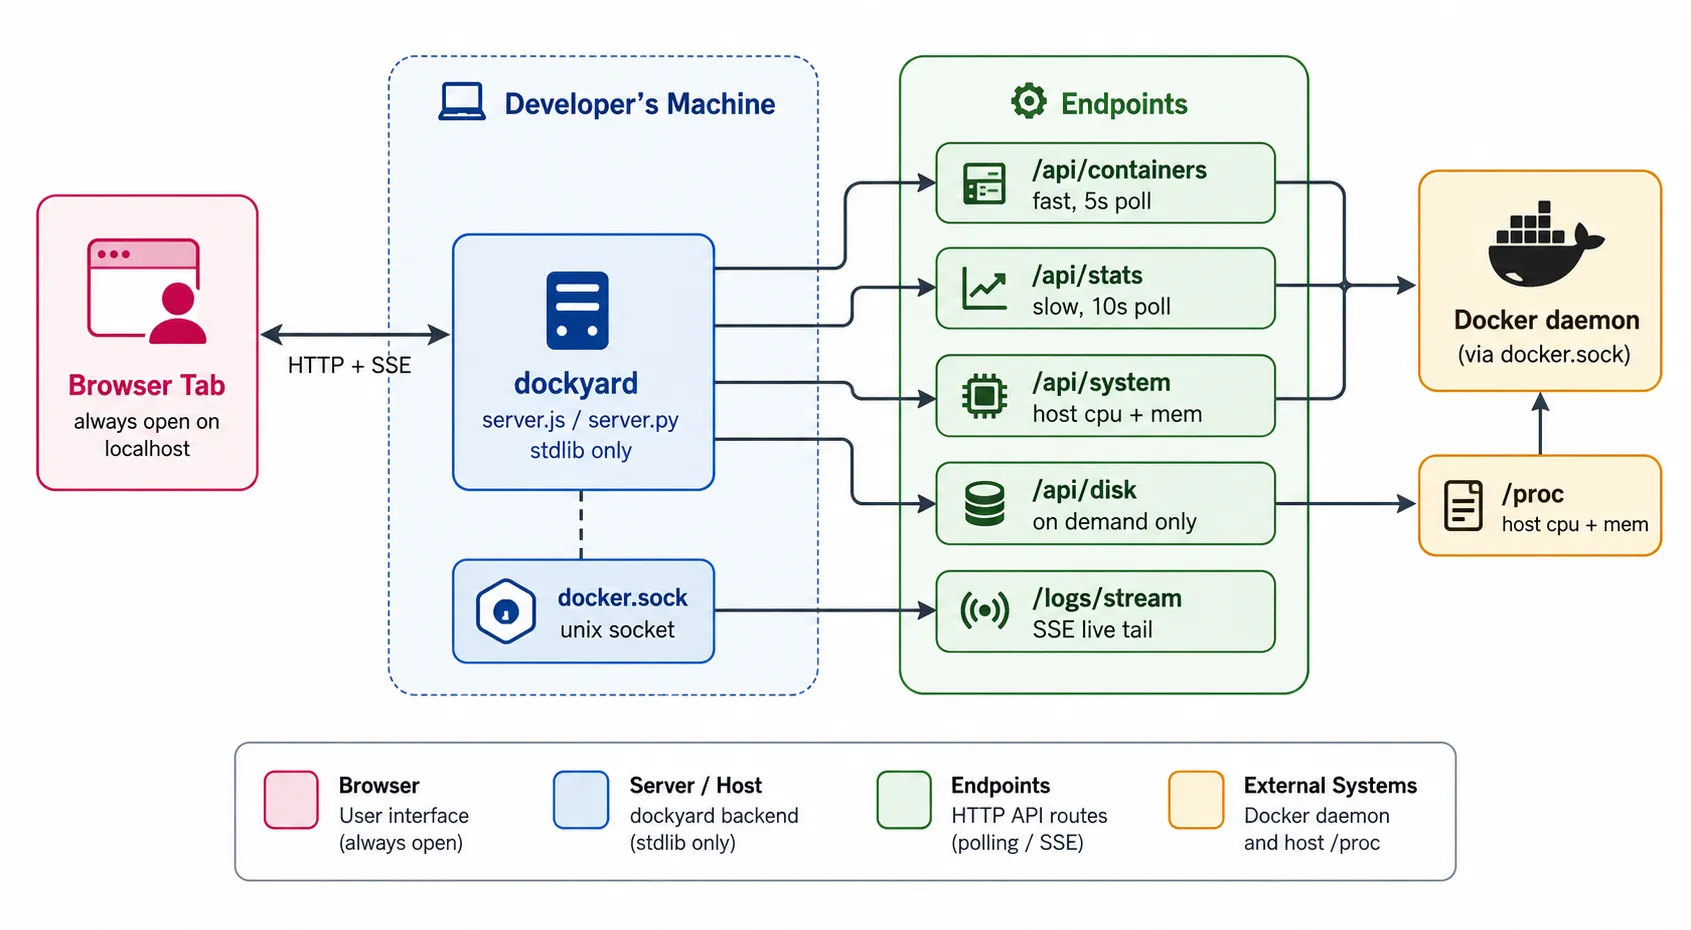
Some endpoints are much slower than they look. Each stats reading makes the daemon take two
measurements about a second apart, which came to roughly 8 seconds for 20 containers even pooled 8 at a
time, so the container list had to be its own fast endpoint that paints immediately. /system/df walks
every layer, container and volume, and took 47 seconds on a cold daemon. That one is a button, not a
poll.
Building It with Claude
I wrote all of this with Claude Code CLI. The useful part was not code generation, it was asking for measurements instead of opinions.
The first version was too dim in places. I knew that much, but not by how much or exactly where. Asking for a review got contrast ratios computed for every colour pair, which put numbers on it: the dense data (image tags, short ids, ports) was dimmer than the chrome around it, so the palette had it backwards. The rebuild worked from those values rather than from my eye.
The same held when I added start, stop and restart. The point that mattered was not the endpoints, it
was that 127.0.0.1 is not a boundary against a browser: any page you have open can POST to a loopback
port, and as a simple request it goes with no preflight. So writes require a JSON content type, a
custom header, and a loopback-looking Host and Origin, the last being what stops DNS rebinding.
That is the stuff you skip on an internal tool because it is “only on localhost”.
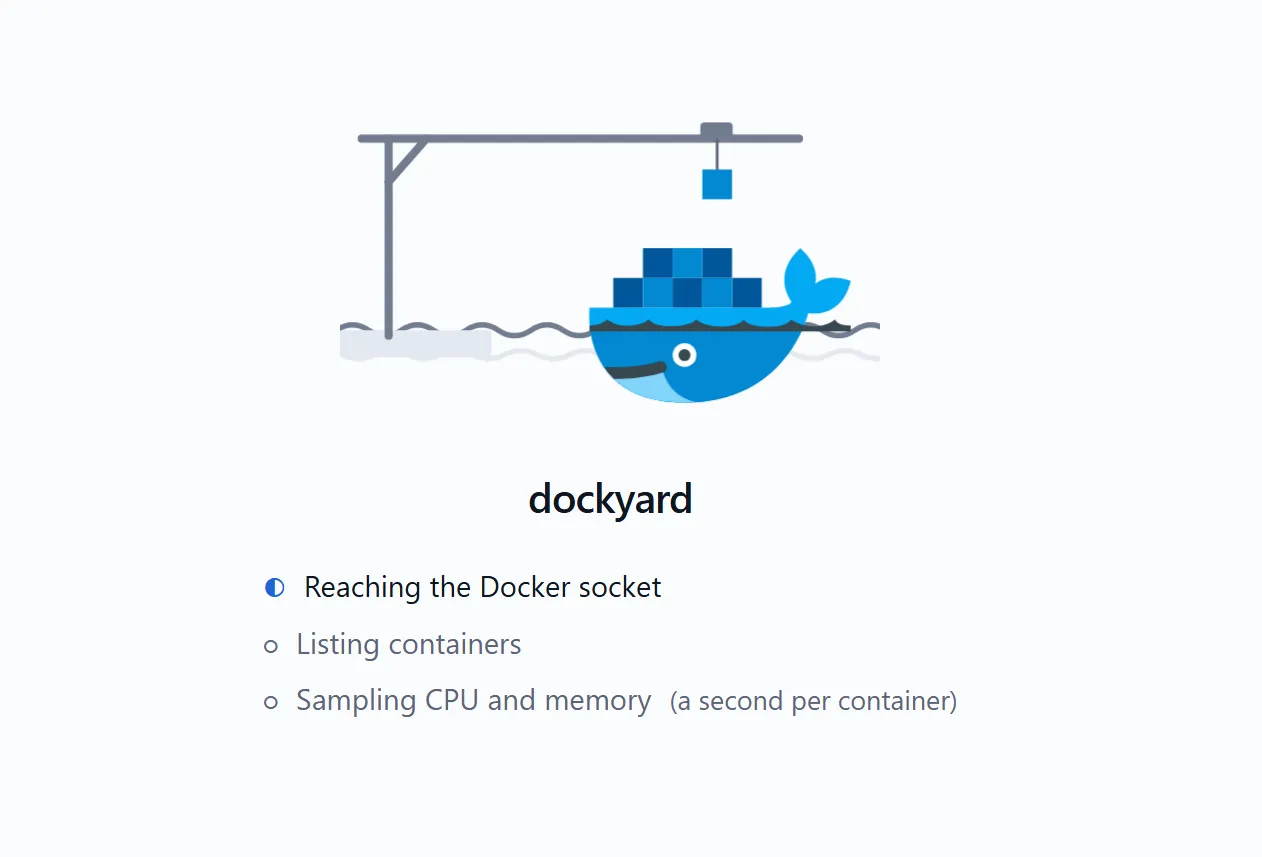
The loading states were the fun part. The boot overlay is an SVG gantry crane lowering a container into the one empty slot in the Docker whale’s stack, over scrolling waves. Under it, a three step checklist that advances on real fetch completion rather than a timer, because the stats step takes about 8 seconds and a spinner held that long reads as stuck. The overlay leaves after a second, once the list is usable, and sampling finishes behind shimmer placeholder rows.
On time: a working version took under an hour, and something I would call finished landed inside a day. The Python port for boxes without Node came in the same morning, in one pass.
What I Accepted
- The log filter is client-side, over the loaded buffer. The Docker logs API has no grep, so searching deeper means fetch and scan. Fleet-wide search is a different feature and I have not built it.
- No auth. It binds to loopback and an SSH tunnel covers the rest. Anything that can reach the port can read every container’s log, which often means tokens and connection strings.
Takeaway
The tool is unremarkable: one HTML file, one server file, no dependencies. It was worth building because the pain was frequent and small, the kind you absorb instead of fixing.
The zero dependency constraint paid off in a way I had not planned for. Sharing it with teammates on other projects is just sending them a file and telling them to run it, with nothing to install and no lockfile to go stale, which is also why the Python port was worth asking for. They are using it now and have found it genuinely useful, so the crowded dev box was not only my problem.
Building it with an AI tool was quick, but the more useful part was being able to ask for numbers instead of opinions. The sampling time, the disk usage call, the payload on a container switch: those were measured rather than estimated, and each one changed how something works.
📦 Repo: TODO, add link
One HTML file, one server file, zero dependencies. Started as 76 lines of bash. Built with Claude Code CLI.